Mapping import-export flows isn’t about finding one slow point; it’s about revealing the costly “dead time” between each step.
- Information flow (paperwork) often lags behind the physical goods, creating the most significant customs and transit delays.
- Communication silos between sales, logistics, and transport partners are the biggest source of preventable waste and variation in lead times.
Recommendation: Start by physically walking the actual process from customer order to final delivery, timing both value-added activities and, more importantly, the wait times in between.
For any process improvement manager, the wild variability of international shipping is a constant source of frustration. A container traveling the same route can take 30 days on one shipment and 45 on the next, with no obvious explanation. Teams often resort to tracking containers more closely or blaming carriers, but these are symptoms, not the root cause. The real problem isn’t the physical movement of goods; it’s the invisible friction that occurs at every handoff point in the chain.
The core challenge lies in the disconnect between the physical flow of materials and the digital or paper-based flow of information. A container can arrive at a port, but if the customs documentation isn’t ready, it sits idle. This “handoff latency” accumulates at every stage: from sales making a promise to a customer, to the warehouse preparing the order, to the broker filing the customs entry, and finally to the last-mile delivery truck. These are the hidden bottlenecks that traditional tracking systems fail to see.
But what if you could visualize this entire, fragmented process as a single, continuous stream? The solution is not another piece of software, but a change in perspective. By adapting the principles of value stream mapping (VSM)—a cornerstone of lean manufacturing—to the unique complexities of global trade, you can make these invisible delays visible. This allows you to stop firefighting and start systematically designing a faster, more reliable, and less costly import-export process.
This article provides a structured methodology for applying VSM to your cross-border logistics. We will dissect the process, from identifying the root causes of delays to creating a visual map that exposes waste and guides targeted improvements. The following sections break down each critical component of this analysis.
Summary: How to Map Import-Export Flows and Eliminate Hidden Bottlenecks
- Why Lead Times Vary Wildly Even on the Same Route?
- How to Create a Value Stream Map for Cross-Border Logistics?
- The Communication Silo Between Sales and Logistics That Delays Orders
- Integrating ERP with Customs Software: Problem & Solution for Data Entry
- From Order to Delivery: A Sequence of Critical Checkpoints
- Why Communication Gaps Between Warehouse and Transport Cost Millions?
- Why Manual Invoice Processing Costs You $15 Per Document?
- How to Manage Global Logistics Volatility in an Era of Disruption?
Why Lead Times Vary Wildly Even on the Same Route?
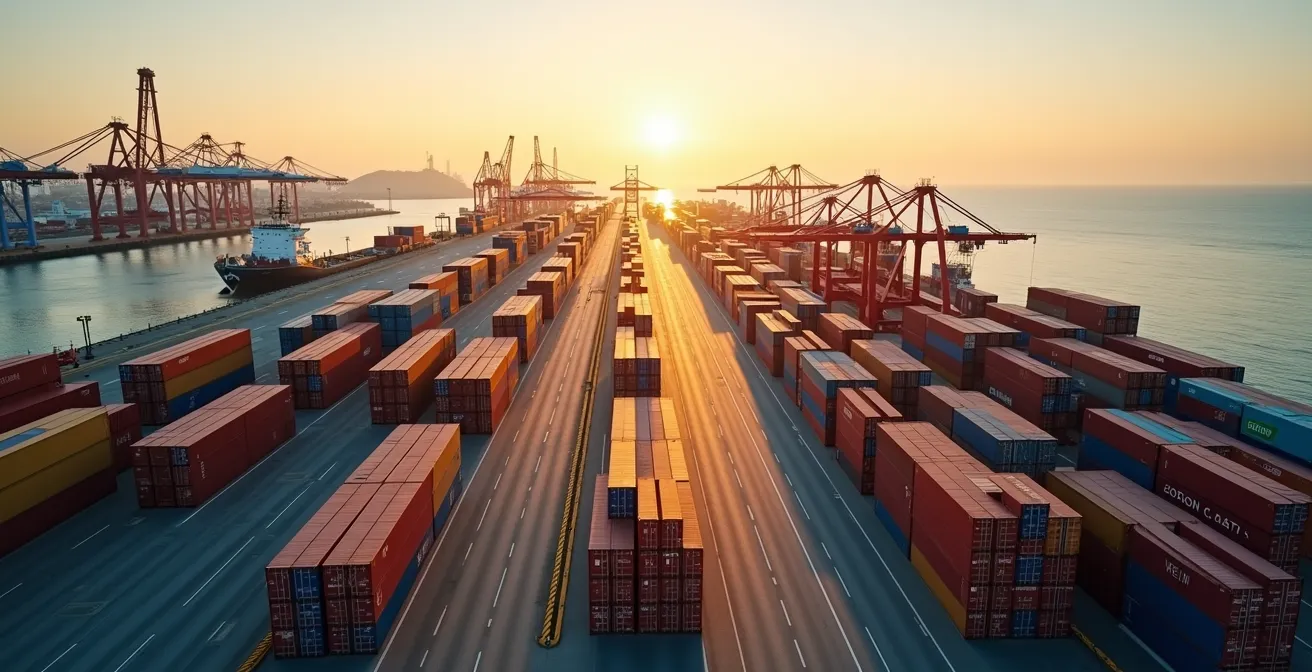
The assumption that a shipping route is a fixed variable is a primary reason why bottlenecks remain hidden. In reality, the physical transit time is often a smaller component of the total lead time. The real culprits are the process variations that occur before departure and after arrival. These variations are driven by dependencies that are not immediately obvious, such as documentation processing, port congestion, and reliance on a single point of entry or exit.

As the image above abstractly suggests, international trade is buried in paperwork. Each document—from the bill of lading to the commercial invoice and certificate of origin—represents a potential delay. An error or omission on one form can halt the entire process. Furthermore, many companies discover through process mapping that they have a critical dependency on a single port. An event like a labor strike or natural disaster at that one location can completely sever a supply chain, creating cascading failures. The problem isn’t a slow ship; it’s a fragile process with unexamined single points of failure. The first step in mapping is to identify these hidden dependencies that create handoff latency long before a container is even loaded.
How to Create a Value Stream Map for Cross-Border Logistics?
Value Stream Mapping (VSM) is the definitive tool for making process inefficiencies visible. While traditionally used in manufacturing, its principles are perfectly suited for dissecting complex logistics flows. The goal is to differentiate between value-added time (activities the customer pays for, like transit) and non-value-added time (waste, like waiting for customs clearance). In global logistics, it’s common to find that over 90% of the total lead time is non-value-added wait time. Creating a VSM forces you to quantify this waste.
A rope manufacturing company, for example, used VSM to analyze its processes. The mapping exercise revealed that by simply reorganizing the facility layout to improve material flow, they achieved a 33% reduction in material handling time. More importantly, the VSM workshop was the first time executives from different departments had ever met in person, exposing the deep communication silos that were the true source of delays. The map becomes both a diagnostic tool and a catalyst for cross-functional collaboration.
Your Action Plan: Creating a Logistics Value Stream Map
- Form a cross-functional team with representatives from sales, operations, inventory, and customer service.
- Define the scope: start with a single product family and map from the customer order to final delivery.
- Walk the actual process flow with a notepad and stopwatch; do not rely on reports or what people say they do.
- Start mapping from the customer end and work upstream to suppliers, documenting every handoff.
- Document both the material flow (the physical product) and the information flow (orders, forms, emails) separately.
- Place “kaizen bursts” or improvement ideas on the map around major bottlenecks, like long wait times at customs.
- Calculate the total lead time versus the total value-added processing time to get a process efficiency percentage.
- Create a “future state” map that designs out the identified waste and sets a target for improvement.
The Communication Silo Between Sales and Logistics That Delays Orders
One of the most significant and costly bottlenecks in any import-export operation is the communication gap between the commercial team and the logistics team. This is a classic example of a cross-functional blind spot. The sales department, focused on closing deals, may promise a customer a delivery date without a full understanding of current port congestion, customs inspection timelines, or carrier capacity. This creates an expectation that the logistics team is immediately set up to fail.

When logistics cannot meet the promised deadline, it leads to frantic emails, customer dissatisfaction, and often expensive, expedited shipping to fix the problem. The issue is not malice or incompetence; it’s a structural silo. Each department is optimizing for its own metrics (sales volume vs. on-time delivery) without a shared view of the entire value stream. VSM is powerful because it forces these teams into the same room, often for the first time, to walk through the process together. This shared understanding is the first step to creating a feedback loop where sales has visibility into logistics constraints, and logistics understands the commercial priorities.
Integrating ERP with Customs Software: Problem & Solution for Data Entry
The handoff between a company’s internal systems (like an Enterprise Resource Planning or ERP system) and the external systems of customs brokers and government agencies is a major source of information-flow bottlenecks. Manual data entry is the enemy of speed and accuracy. When an employee has to copy and paste or re-type information from a sales order into a customs declaration form, the risk of error skyrockets. These are not minor mistakes; they have significant time and cost implications.
In fact, the data shows just how critical this step is. Analysis of customs clearance processes reveals that an astonishing 45% of customs delays are caused by incomplete documentation, with incorrect product classification (HS codes) accounting for another large portion. A simple typo can lead to a shipment being held for days or even weeks, accumulating demurrage fees and disrupting production schedules. The table below illustrates the common causes and their typical impact.
| Delay Cause | Percentage | Typical Resolution Time |
|---|---|---|
| Incomplete documentation | 45% | 3-7 days |
| Incorrect HS codes | 25% | 2-5 days |
| Physical inspections | 20% | 1-3 days |
| Missing certificates | 10% | 7-14 days |
The solution lies in system integration. A future-state value stream map would show a direct, automated data flow from the ERP to the customs software, eliminating manual entry. This not only accelerates the process but also enforces data integrity, ensuring that the information required by customs is correct from the very beginning. This transforms customs clearance from a variable bottleneck into a predictable checkpoint.
From Order to Delivery: A Sequence of Critical Checkpoints
A cross-border shipment is not a single journey; it is a sequence of handoffs between multiple independent parties. Viewing the process as a chain of critical checkpoints is essential for effective mapping. These are not just process steps, but points of transfer where responsibility, risk, and information are exchanged. Key checkpoints include: order confirmation, cargo ready at the factory, port of departure, transshipment port (if any), port of arrival, customs clearance, and final delivery.
At each checkpoint, the potential for “wait time” is immense. The value stream map must capture the time spent at each of these stages. The total lead time is the sum of all processing times and all wait times. The vulnerability of these checkpoints was starkly illustrated by the 2011 earthquake in Japan. This single event at one geographical checkpoint caused a massive disruption to global supply chains, particularly in the automotive industry, which relied heavily on components from the affected region. Companies that had not mapped their supply chains were left scrambling to even identify which of their suppliers were impacted. This highlights that a bottleneck isn’t always a slow process; sometimes it’s a complete stop at a critical, un-audited checkpoint.
Why Communication Gaps Between Warehouse and Transport Cost Millions?
Another classic silo exists at the junction of the warehouse and the transport provider. The warehouse team’s goal is to prepare orders efficiently, while the transport provider’s goal is to maximize vehicle utilization. When these two functions are not synchronized, significant waste occurs. A truck may arrive for a pickup before the order is packed and staged, resulting in costly driver detention fees and a delayed departure. Conversely, a completed order may sit on the dock for hours, or even days, waiting for a truck to become available, tying up space and capital.
This misalignment is often exacerbated by poor demand forecasting and a lack of shared visibility. The warehouse may be operating based on a forecast, while the transport provider is reacting to real-time bookings. When a large, unexpected order comes in, the entire system can break down. The infamous 2021 blockage of the Suez Canal by the Ever Given cargo ship serves as a macro-scale example of this principle. The incident created a massive physical bottleneck, but the ripple effects were magnified by poor communication. Downstream, warehouses and transport providers were unable to adjust their plans effectively because they lacked clear information on which shipments were delayed and for how long, leading to chaos, stockouts, and immense financial losses across global trade.
Why Manual Invoice Processing Costs You $15 Per Document?
While the physical movement of goods gets most of the attention, the financial and administrative processes that run in parallel are often riddled with their own expensive bottlenecks. Manual invoice processing—for freight, duties, and other services—is a prime example of an information-flow bottleneck that directly impacts the bottom line. Although the exact cost varies, industry estimates often place the expense of manually processing a single trade-related invoice anywhere from $10 to $20 when all labor, error correction, and payment delays are factored in.

This cost is composed of multiple forms of “waste.” It includes the labor time to receive, verify, and enter the invoice into a payment system. It also includes the time spent resolving discrepancies between the invoice, the purchase order, and the proof of delivery. These delays can lead to missed early payment discounts or, conversely, late payment penalties. Automating this workflow through technologies like Optical Character Recognition (OCR) and integration with accounting systems is a core component of a “future state” value stream. By treating the invoice flow with the same process rigor as the material flow, companies can unlock significant cash flow and reduce administrative overhead.
Key Takeaways
- Bottlenecks hide in the “wait time” between process steps, not within the steps themselves.
- Mapping both the physical product flow and the information flow separately is crucial; information delays are the most common issue.
- A cross-functional team is non-negotiable for an accurate map, as it reveals communication silos that reports hide.
How to Manage Global Logistics Volatility in an Era of Disruption?
In today’s environment, disruption is the new normal. The ability to manage volatility is no longer a competitive advantage; it’s a requirement for survival. The value stream mapping exercise is not just about identifying and eliminating current bottlenecks; it is the foundation for building a more resilient and agile supply chain. A well-documented map provides the visibility needed to respond effectively when disruptions occur.
The COVID-19 pandemic provided a stark lesson in this regard. Companies that had previously mapped their supply chains were better positioned to react. They could quickly identify their dependencies on suppliers in locked-down regions and activate contingency plans. In contrast, those without this visibility were flying blind, unable to predict the impact on their operations. The VSM is a strategic tool that moves a company from a reactive to a proactive stance. It allows for “what-if” scenario planning: What if our primary port closes? What if our key carrier loses capacity? The map provides the data to answer these questions.
| Pricing Term | Coverage | Responsibility Transfer Point | Best Used When |
|---|---|---|---|
| FOB (Free On Board) | Costs to departure port only | At departure port | Buyer controls shipping |
| CIF (Cost, Insurance, Freight) | Delivery to destination port | At destination port | Seller manages logistics |
Furthermore, understanding the process flow allows for smarter strategic decisions, such as choosing the right Incoterms (like FOB or CIF) to balance cost, control, and risk. A detailed process map informs this choice, making it a strategic decision rather than a default setting. Ultimately, mapping your flows is the first and most critical step in transforming your supply chain from a fragile liability into a resilient, strategic asset.
Start today by choosing a single, high-impact product line and begin walking its flow. Applying these value stream mapping principles is the first step toward reclaiming control over your supply chain and turning volatility into a competitive advantage.